Nancy Baxter, The University of Melbourne and Tony Blakely, The University of Melbourne
A man from Wollert, a suburb in Melbourne’s north, breezed into Melbourne from South Australian hotel quarantine, stopped at a 7-11, had a curry, shopped in Epping, took a train, and at some point, had a passing encounter with a stranger. Perhaps he coughed or spoke, or was simply breathing, but that was enough for a waft of aerosol to transmit COVID-19 to Melbourne’s missing link.
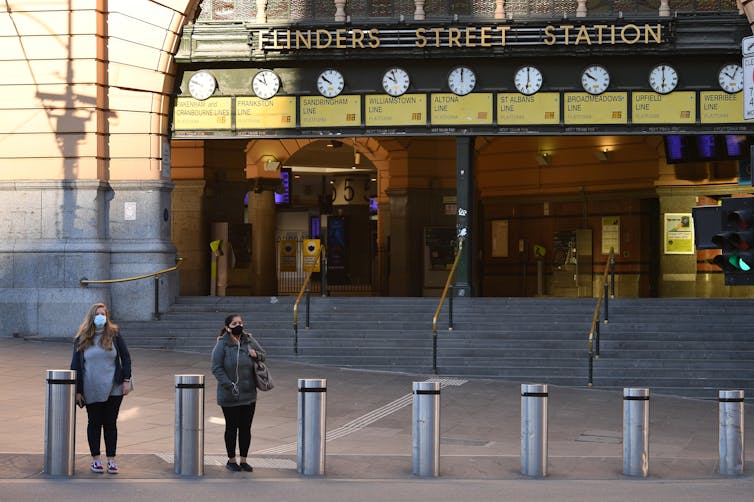
Three weeks later, at least 63 people in Victoria are infected with the Kappa variant (B.1.617.1), the whole of Victoria is in lockdown, there’s political conflict and fallout about South Australia quarantine and the bungled aged care vaccine rollout, and Victorians are rushing to get vaccinated.
Let’s rewind time and pick an alternate universe. Let’s say the Wollert man returns to Melbourne from quarantine in Adelaide, stops at a 7-11, has a curry, left his keys at the restaurant and had to go back and get them before going to shop in Epping. Luckily, he had no fleeting encounters with a stranger where aerosol wafted from him to them carrying the virus. Melbourne escaped a lockdown, without even knowing it, all because a man forgot his keys.
Life is random, and COVID is very much so. A difference in seemingly innocuous circumstances can lead to very different outcomes.
The key point is that chance matters. It’s unlikely Victoria is doing anything that “makes us” more likely to have outbreaks leading to lockdowns.
The butterfly effect
Even a very small difference early in a chain of events can lead to a vastly different outcome.
This might be a potential superspreader deciding to go hiking alone for the weekend, not to his Aunt’s birthday party. Or an aged care worker picking up an extra shift at a second facility. Or a man from Wollert forgetting his keys.
This is what is sometimes called the butterfly effect.
In simulation modelling, we call this “stochasticity”. We incorporate stochasticity into our models to reflect the chance events which happen in real life. Using this approach to modeling, when we simulate transmission of COVID-19 infections in groups of people, we see very different outcomes each time the model is run, even when the parameters we set for the model are exactly the same.
Each run shows us a different possible unfolding of the future. This is because a seemingly small random difference can alter the whole future.
In our COVID-19 Pandemic Tradeoffs website, you can see this for yourself by drilling down to look at some of the 100 runs (stochastically varying) we do for each of 600+ scenarios. Each individual scenario has the same “initial conditions”, including the same reproductive rate, which refers to how many people on average one person with the virus will infect. But there’s still a huge component of chance in each of its 100 runs.
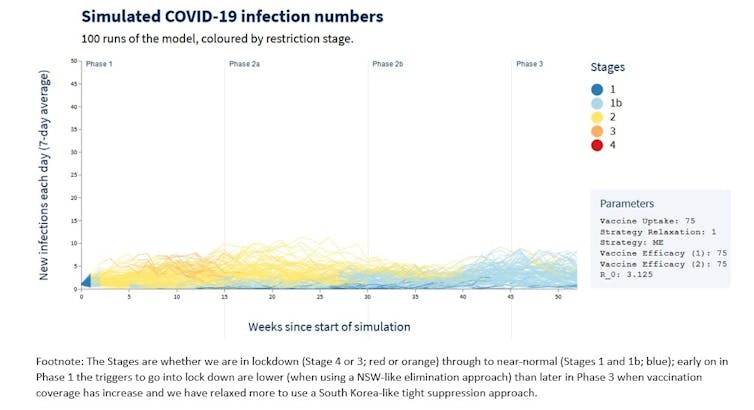
For example, the graph above shows 100 stochastic simulations of what the daily infection rate with COVID-19 might be in Victoria under the following circumstances:
- if we continue to have ongoing COVID-19 introductions, due to inadequacies in our hotel quarantine system
- if our vaccine roll out was progressing as originally planned (remember the October timeline?)
- if the vaccine reduced transmission moderately well
- if we relax our thresholds to go into lockdown as our vaccine coverage increases. So, if we used a NSW-like moderate elimination approach early on during Phase 1 of the vaccine rollout, and over time evolved into a more South Korea-like tight suppression approach in Phase 2B when we are vaccinating all remaining adults.
Each line represents a run of the simulation.
The key thing to note is how the runs vary from each other. In some cases the infections fizzle out. In others, case numbers rise. Because of chance events, each simulation of the future looks different. But now is different from last year due to a more infectious variant.
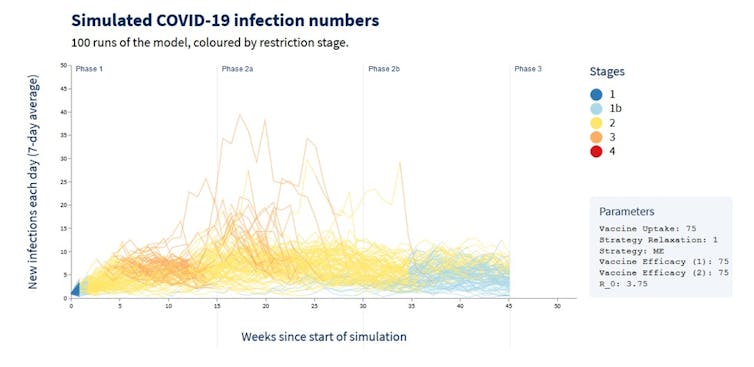
The figure below is for the exact same scenario as above, except the infectiousness of the virus is higher, more in line with the Kappa (B.1.617.1) variant we’re now dealing with in Victoria.
Some of the runs now have high daily infection rates (by Australian standards), but notably in some scenarios the infection rate continues to be low. This is how random chance events play out on a population level.
What about contact tracing, weather, and good public transport?
Contacting tracing was inadequate in Victoria at the start of the pandemic, but since our second wave, our contact tracing has been outstanding. Deficiencies there do not explain the frequency of our lockdowns.
Could it be our interconnectedness and good public transportation? Well, with outbreaks affecting many commuter cities — think Phoenix and Los Angeles in the United States — it doesn’t appear travelling in your car and staying in your suburb protects you.
Is it our younger demographic? An older median age does not make a city immune — take Montreal where the median age is nearly 40.
We have had lockdowns in summer and in winter, so our colder climate does not necessarily explain it either.
What makes Melbourne distinct in terms of culture and geography can never explain why the Wollert man transmitted COVID to the missing link. At the end of the day we have chance, stochasticity, and some butterflies not flying our way. We have just been unlucky.
Oh, and if we want to improve our luck, let’s do something about hotel quarantine.
Nancy Baxter, Professor and Head of Melbourne School of Population & Global Health, The University of Melbourne and Tony Blakely, Professor of Epidemiology, Population Interventions Unit, Centre for Epidemiology and Biostatistics, Melbourne School of Population and Global Health, The University of Melbourne
This article is republished from The Conversation under a Creative Commons license. Read the original article.


